Top Useful Agile Metrics: Measure Quality, Productivity & Performance
Agile metrics are a crucial part of an agile software development process. They help software teams monitor productivity across workflow stages, access software quality, as well as introduce more clarity to the development process. Metrics in agile software development can also help scrum and kanban masters keep track of their teams’ well-being.
For our list, we have chose the metrics that can be useful for the majority of agile teams. There four different metrics groups in our selection — software quality, team productivity, general project metrics, and team performance/well-being agile metrics.
See the list below.
Agile Quality Metrics
This group of agile development metrics will help you access the overall quality of the software product your team is building, as well as predict whether users will be satisfied with its quality.
Escaped Defects
This metric will help you identify the number of bugs after a build or release enters production. Using the escaped defects metric helps teams access the level of software qualify, although in a rather raw form. This is one of the agile quality metrics you should consider using: bugs on production always pose problems.
Failed Deployments
The following metric will help you access the overall number of deployments to testing and production environments. Failed deployments can shed light on how reliable those environments are and whether a team is building working software at all. Concurrently, you can use the the failed deployments metrics to understand whether a given sprint or release is ready to go to production. As far as quality metrics in agile software development go, failed deployments is incredibly useful.
Net Promoter Score (NPS)
NPS measures the reaction of users to a given release. The metric can help teams predict whether the users would recommend the software product or not. NPS is measured right before the release. Although one of agile software quality metrics in our list, Net Promoter Score can also be approached as a customer satisfaction metric.
Agile Productivity Metrics
The following selection of agile development metrics helps to assess your team’s productivity in completing stories, tasks, and bigger bodies of work. The many useful agile productivity metrics will also help you predict the productivity of your team in forthcoming sprints, prevent bottlenecks, and tackle unexpected changes to the scope.
Lead Time
This metric will let you monitor a story from the point when it enters the backlog until the sprint’s end or release stage. The lower the lead time, the more effective your development process is. Lead time is one of those agile metrics that allows for gaining an overarching perspective on the productivity of your development efforts.
Cycle Time (Control Chart)
Part of the lead time metric, cycle time will help you assess the average speed with which your team fulfills a task. If your team has short cycle times, it means they are highly effective. Concurrently, when your team’s cycle team is consistent, you can better predict how they will work in the future. This metric will also help you to quickly pinpoint the emerging bottlenecks in your agile software development process.
Sprint Burndown
Before starting a sprint, teams forecasts how much work they can finish in the course of it. The sprint burndown report (visualised as a chart) tracks the completion of story points in a given sprint. This helps the team to ensure they will complete the sprint scope within the planned time frame.
Sprint burndown chart example, Scrum Institute
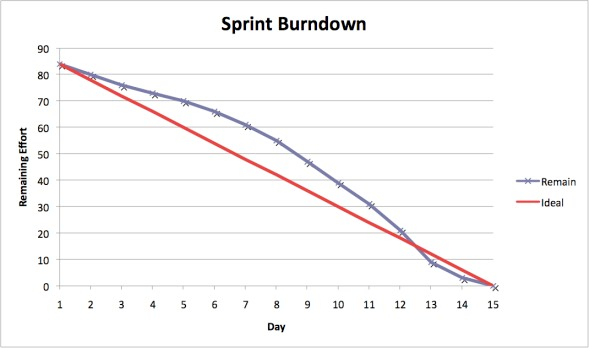
Sprint burndown is one of the most effective agile productivity metrics for a few more reasons. First, it allows you to track the progress of a sprint closely and in real time. Second, the metric shows how agile your team really is.
Epic & Release Burndown
These metrics (also visualised as charts) allow teams to track bigger bodies of work than sprint burndown can cover. One of the major benefits of epic and release burndown is that they help to manage “scope creep” — the adding of new requirements after the project was already defined.
Thus, these agile metrics will help ensure your team will not lose in productivity, for example, after the product owner on your project tasks your team to add a new, massive feature.
Velocity
Velocity is one of the most essential metrics in agile software development, allowing you to measure the average quantity of completed story points over several past sprints. Consequently, you can use the metric to foresee how effective your team will be in forthcoming sprints, making it a rather powerful planning means.
Velocity chart example, Atlassian
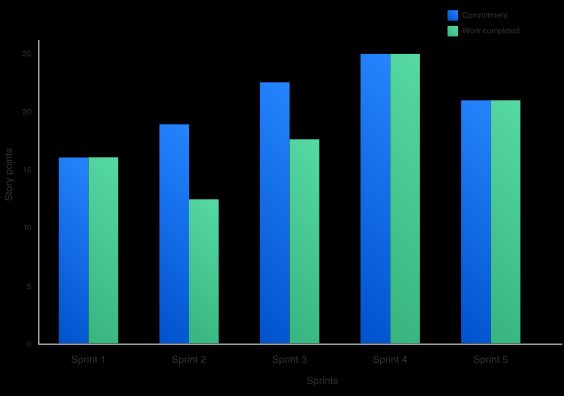
The benefits of velocity also include:
- Easy to measure
- Shows a clear result right away
- Lowering velocity may signal about emergings inefficiencies in a sprint
As many factors can influence productivity, it is crucial to follow how your team’s velocity changes over time.
Agile Project Metrics
A handy addition to the aforementioned metrics, agile software project metrics will provide actionable information on your development processes, helping to avoid issues big and small.
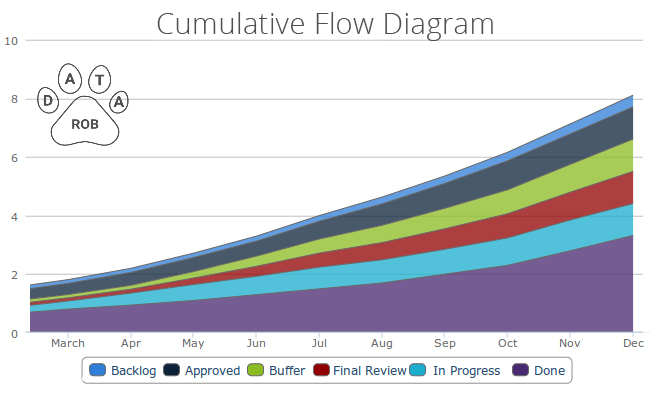
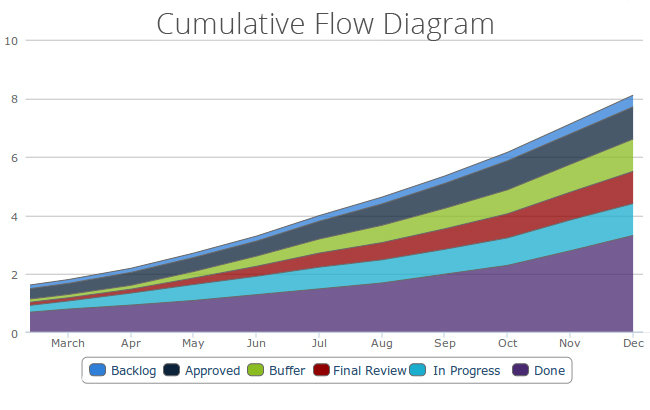
Cumulative Flow
Cumulative flow is arguably one of the most powerful agile project metrics for kanban. It enables you to get a bird’s-eye view on the status of your tasks in a sprint, release, and across software teams. In a single diagram, you will be able to view the status of your tasks for all workflow stages. You would also immediately identify bottlenecks at any stage.
gile
Cumulative Flow Diagram example, kanban tool
Code Coverage
This metric calculates the percentage of code that is covered by unit tests, presenting it in a raw visualisation. You can measure code coverage by the quantity of methods, conditions, statements, and branches that comprise your unit testing suite. You can also run code coverage automatically as part of every build.
While code coverage is one of the effective agile metrics, it does not cover other types of testing. Therefore, high code coverage numbers do not signify high quality. Still, the metric will give you a solid perspective on your progress.
Health Metrics for Agile Teams/Agile Performance Metrics
While most agile software development metrics are aimed at assessing software quality and team productivity at different stages and from different perspectives, monitoring the well-being of your team is as crucial.
Happiness
There is no single, tried-and-true way to measure happiness in a software development team. Still, a common solution is to ask every team member to rate current happiness on a scale from 1 to 5. According to organizational psychologist Christiaan Verwijs, this can be followed by several questions, for example:
- How happy are you with your company?
- What feels best right now? (open question)
- What feels worst right now? (open question)
- What would increase your happiness? (open question)
Team Morale
Verwijs proposes another way to access the well-being of members of agile software development teams — measure team morale instead of happiness. He argues that the happiness metric is unreliable due to its subjectivity, and that measuring it entails many nuances that does not help to solve the problem neither for the individual, nor their team. Instead, Verwijs says that measuring team morale is a more subtle, team and task oriented way biased or susceptible to changes in mood.
The psychologist suggests to measure team morale by asking team members to rate the following statements on the scale from 1 to 5 (or from 1 to 7, as it more nuanced):
- I feel fit and strong in my team
- I am proud of the work that I do for my team
- I am enthusiastic about the work that I do for my team
- I find the work that I do for my team of meaning and purpose
The questions are more specific, allowing you to better access the well-being of your team members.
Still, approaching and accessing such aspects is a nuanced subject, and it is up to the scrum or kanban master to choose the most fitting of these agile performance metrics, or approach the team members’ well-being in their own individual way altogether.
Should you use these metrics for agile teams at all is another question you might ask, especially if you can have face-to-face discussions whenever you need to talk through your team members’ issues. If you have doubts about agile team performance metrics, you can start small by measuring happiness monthly, and see how everything goes.
What are the Key Agile Software Development Metrics?
Our selection includes agile software development metrics that will aid in delivering quality software on time while ensuring the well-being of your team members. Still, using each and every one of the metrics on the list is not a precondition for creating shippable software products. In the end, the choice depends on a team’s scrum or kanban master, the team, and the agile culture in the organization or the team.